
As humans, and particularly as users of the Internet, we are constantly evaluating, judging and making decisions based on content, context, our knowledge or previous experiences. All of these factors influence any decision we make when browsing the internet.
And it is highly likely that all these actions are being recorded using a tracking pixel. In fact, more than 38 million websites use Google Analytics to track user behaviour. From opening a page on a website to completing a contact form or online booking, your actions are being tracked.
As users, we rely on a quick qualitative analysis to make these decisions: what button looks more appealing, which photo better describes the service we are after and how enticing a downloadable report is. However, with the use of tracking pixels, business owners have access to better tools and quantitative data to help them understand the users’ journey and more importantly, incorporate analytics into the design process to improve user experience.
As the leading analytics tool in the market, Google Analytics has constantly evolved throughout the years. While their latest release, GA4, was received with a lot of criticism from marketers, developers and business owners, the reality is that it is here to stay. Despite the changes in terms of default reports and user experience, it provides the same and perhaps more powerful tools than previous versions.
To understand users’ journeys and be able to tell a better story, it is key to speak the data language, be aware of the possibilities and have an idea of the available tools for the trade. This will ultimately help to make better-informed decisions. Here are some key elements that will help you start your own analytics journey.
GA4: The basics
Google made a big effort to inform everyone what was happening on the 1st of July 2023. Although Google inundated everyone’s inboxes with emails, deadlines, and almost apocalyptic warnings; in a lot of cases the transition was easy as Google offered the option to use the existing Google Tag to transition and start tracking without major hiccups.
A lot of things changed in the dashboards and user’s frontend. Most standard reports disappeared and the reason behind this is a change of the measurement model. In previous versions of Google Analytics everything was built around sessions and page views. In GA4 every interaction is an event, including page views, conversions, clicks, scrolls, etc.
Naturally, with this transition, it is up to users to define how to visualise data and customise reports. At the same time, some metrics are no longer available, including bounce rate, pages per session, or average session duration, which transition to engagement rate, engaged session duration, and engaged sessions per user.
Going beyond standard events
As mentioned before, in GA4 everything is an event. Submitting a form, visiting a page, scrolling, starting a video, viewing a search results page, downloading a file, etc. The good news is that, in most cases, you don’t need to write any additional code to start tracking these events.
But not every website is the same and you probably want to track a different journey to be able to understand how a user interacts with your site or app. In these cases, you will need to implement custom events. For example, while GA4 collects data when a user views a page, you want to know more and understand when someone completes a payment, interacts with a new feature, registers for a webinar or lands on an order confirmation page.
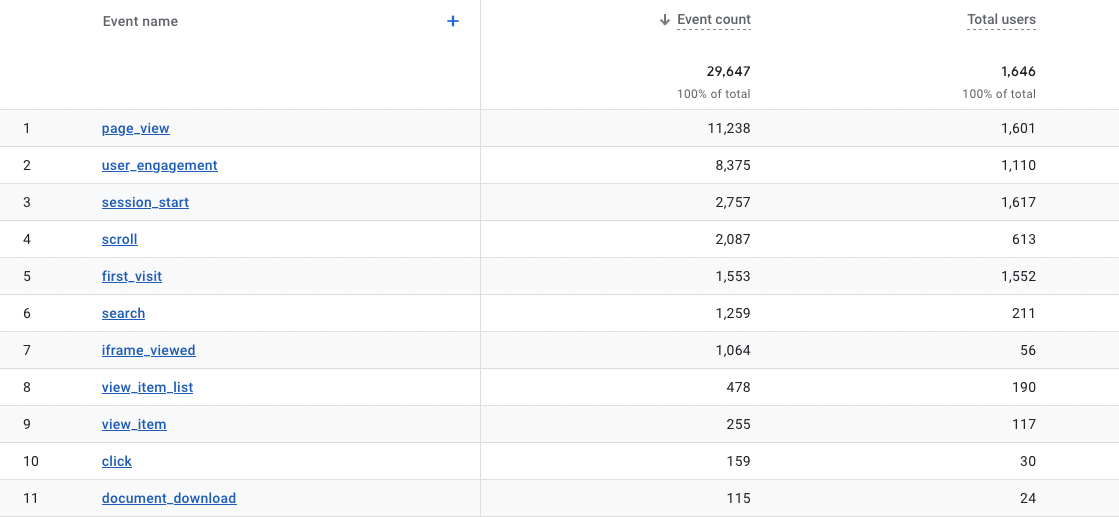
Once you have those events in place, you will be able to visualise these using the default events report in GA4:
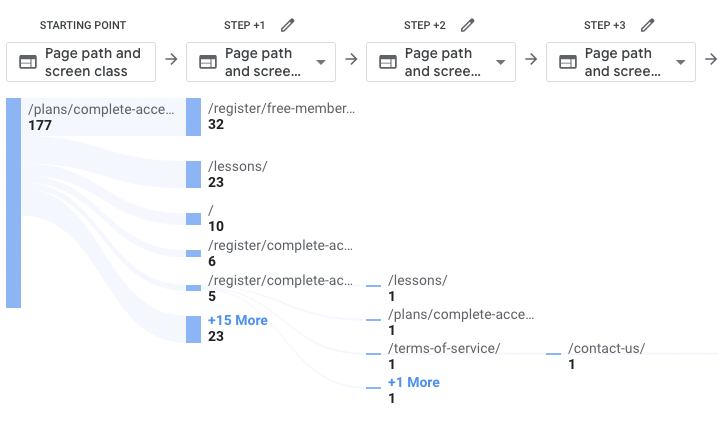
Or if you want to visualise the user journey and understand what leads to conversion, the Explore section in GA4 allows you to create your own reports and views using a combination of events, metrics and dimensions:
Google Tag Manager and the Data Layer
There are many options that allow you to reach that level of customisation and tracking, but perhaps the best and more flexible option is to use Google Tag Manager. When GTM is installed, your website will be able to communicate with different tags or pixels like GA4, Facebook Pixel, Google Ads and any others. You can then manage all tags in a central place, without having to modify the website every time there is a change, or a new pixel need to be added. Plus, you can also trigger events based on the content and actions taken on a specific page.
With tracking in place, you can then start sending data from your website or app to enrich your analytics database. The recommended way to do this is using the data layer. This component allows you to send additional information that is beyond standard GA4 metrics and dimensions. Examples of these include product information and customer data.
The combination of all these layers allows you to add more meaning to data and reports.
Understanding the differences between Universal Analytics and GA4 can make the difference between a rich data set to power your decision-making processes and only getting paralysed by random numbers and reports.
If you are unsure about your GA4 implementation or need help deciphering what’s behind the numbers, get in touch with us and let us decode your own customer journey.
